

Source: AFCARS data, U.S. Children’s Bureau, Administration for Children, Youth and Families
Publication Date: November 30, 2021
Introduction
The report (PDF)and data visualization below present national estimates related to children who experience time in foster care and who are adopted from the foster care system, relative to each Federal Fiscal Year shown. As states are permitted to resubmit AFCARS data, estimates may change over time. This reflects all AFCARS data received as of October 4, 2021 related to AFCARS reporting periods through September 30, 2020.
The national dataset (XLSX)and state data tables (XLSX) are available for download as well.
This chart and other data in this document include data submitted to the Adoption and Foster Care Analysis and Reporting System (AFCARS) by states and the District of Columbia by October 04, 2021.
1 Due to data quality concerns, many of which are associated with the lingering effects of Hurricane Maria, Puerto Rico’s data are only included for the years 2019 and 2020 (foster care), and 2018 through 2020 (adoption). PR is in the process of addressing the quality of their excluded data.
Note that for all of the years shown, some of the data may differ from that shown in earlier versions of this chart. This is due to the fact that some states have resubmitted their AFCARS data after addressing data quality issues.
FY = Federal Fiscal Year (October 1 through September 30)
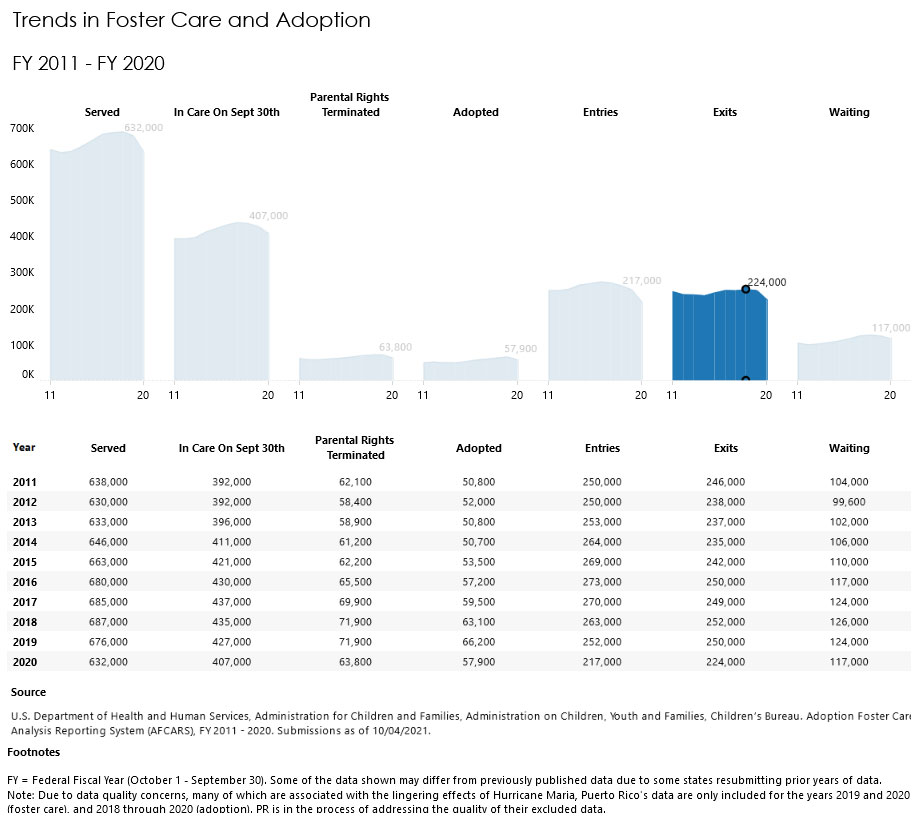
Numbers of Children in Foster Care: Between FY 2012 and FY 2017, the numbers of children in care on the last day of each fiscal year increased. FY 2017’s 437,000 children represents a nearly 11.5 percent increase over FY 2012’s 392,000. While the in-care count of 435,000 for FY 2018 represented a very small decrease compared to FY 2017, the FY 2018 count was 11 percent higher than the count for FY 2012. Moving forward, FY 2019’s count of 427,000 represents a nearly 2 percent decrease compared to FY 2018 and FY 2020’s count of 407,000 represents more than a
4.7 percent decrease from FY 2019. This is notably the fewest numbers of children in care since FY 2014. The 4.7 percent decrease is the largest single year decrease in the last decade.
Entries into and Exits from Foster Care: FY 2011 and 2012’s 250,000 entries into care represented the lowest level of entries during the first nine years of the decade this report covers, 2011 through 2020. Entries into care reached their highest level of the decade with FY 2016’s 273,000. FY 2019’s entries of 252,000 represents a decrease of 21,000, or nearly 8 percent from FY 2016, and FY 2020’s entries of 217,000 is a 14 percent decrease over FY 2019—the lowest number of entries since the collection of AFCARS data began more than two decades ago. The number of exits from FY 2011 through FY2019 fluctuated between 235,000 and 252,000; however, FY 2020’s exits of 224,000 is a 10 percent decrease over FY 2019 and is the fewest number of exits since the collection of AFCARS data began more than two decades ago.
Children Waiting to be Adopted: The numbers of children waiting to be adopted are a subset of those in care on the last day. As might logically be anticipated, as numbers of children in care were declining, the numbers waiting for adoption also declined. When the year-end count of children in care began to increase during the period FY 2013 through FY 2018, the numbers of children waiting for adoption also grew, going from a low in FY 2013 of 102,000 up to 126,000 in FY 2018. It then decreased slightly to 124,000 for FY 2019 and has decreased further to 117,000 for FY 2020. However, notably, the percentage of children who are defined as waiting to be adopted has remained relatively stable over the last decade, averaging between 26 and 29 percent of children in care on the last day. For the last three years, the percentage has remained virtually unchanged at 28.9, 29.0 and 28.7 percent, respectively.
Children Waiting to be Adopted Whose Parents’ Rights Were Terminated: The percentage of children waiting to be adopted whose parents’ rights had been terminated declined from nearly 60 percent in FY 2011 to 56 percent in FY 2016. Since then, the percentage increased slightly each year to 58 percent for FY 2019. Because the population of children waiting to be adopted has grown since FY 2012, in each year since then there has been an increase in the absolute numbers of children whose parents’ rights were terminated, increasing from 58,400 in FY 2012 to 71,900 in FY 2018 and 2019. FY 2020’s number of children whose parents’ rights were terminated fell to 63,800 representing 54.5 percent of the waiting children, the lowest percentage in the decade 2011 through 2020.
Children Adopted: The number of adoptions that were finalized each year remained relatively flat during the FYs 2011 through 2014. However, FY 2015’s 53,500 adoptions represented a 5.5 percent increase over FY 2014’s 50,700. Since FY 2014, adoptions have increased each year to a historic high of 66,200 in FY 2019. However, as a proportion of the exits, during the FYs between 2011 and 2015, adoptions have remained very stable, making up on average 21.5 percent of the foster care discharges each year. Beginning with FY 2016, there has been at least a percentage point increase in adoptions as a percentage of discharges to a high of more than 26.5 percent during FY 2019. FY 2020’s adoptions of 57,900 represents a decrease of 12.5 percent compared FY 2019’s adoptions, although they still approximately 26 percent of the 2020 exits.


